RigCLOUD Analytics
Don't just know your fleet, transform itRigCLOUD LiveOps™
Leverage real-time data to ensure optimal performance, identify potential hazards, manage costs and mitigate risks to ensure the well is delivered safely, on time and on budget.

Optimize Performance
Real-time visibility of key drilling operations. Benchmark well performance across multiple rigs to identify opportunities and drive the adoption of best practices.

Avoid Hazards
Interpretation tools to simplify the identification of drilling hazards due to drillstring and wellbore conditions.

Manage Costs
Enable the execution of consistent repeatable results that drive improved cost by saving time in future well planning processes, identifying inefficiencies and streamlining processes.

Detect Dysfunction
Real-time identification of drilling dysfunctions and equipment misuse to help prevent or minimize downtime, risk to equipment or injury.

Drilling, tripping and casing insights
In-depth analysis of trends that provide insight on performance of drilling crews while making connections, tripping and performing casing runs.
Directional drilling interpretation tools
Real-time monitoring of the well trajectory to ensure it is within tolerance of the plan, establish an understanding of rotary tendencies, identify motor yields and evaluate directional drilling quality through on-demand slide sheet calculations.

Parameter and well performance comparisons
Benchmark current and completed offset wells in real-time to achieve best drilling parameters. Advanced heat maps identify the parameter “sweet spot” to mitigate drilling dysfunctions and optimize ROP through differential pressure and weight on bit (WOB) foundering points.
Drilling engineering analytic plots and visualizations
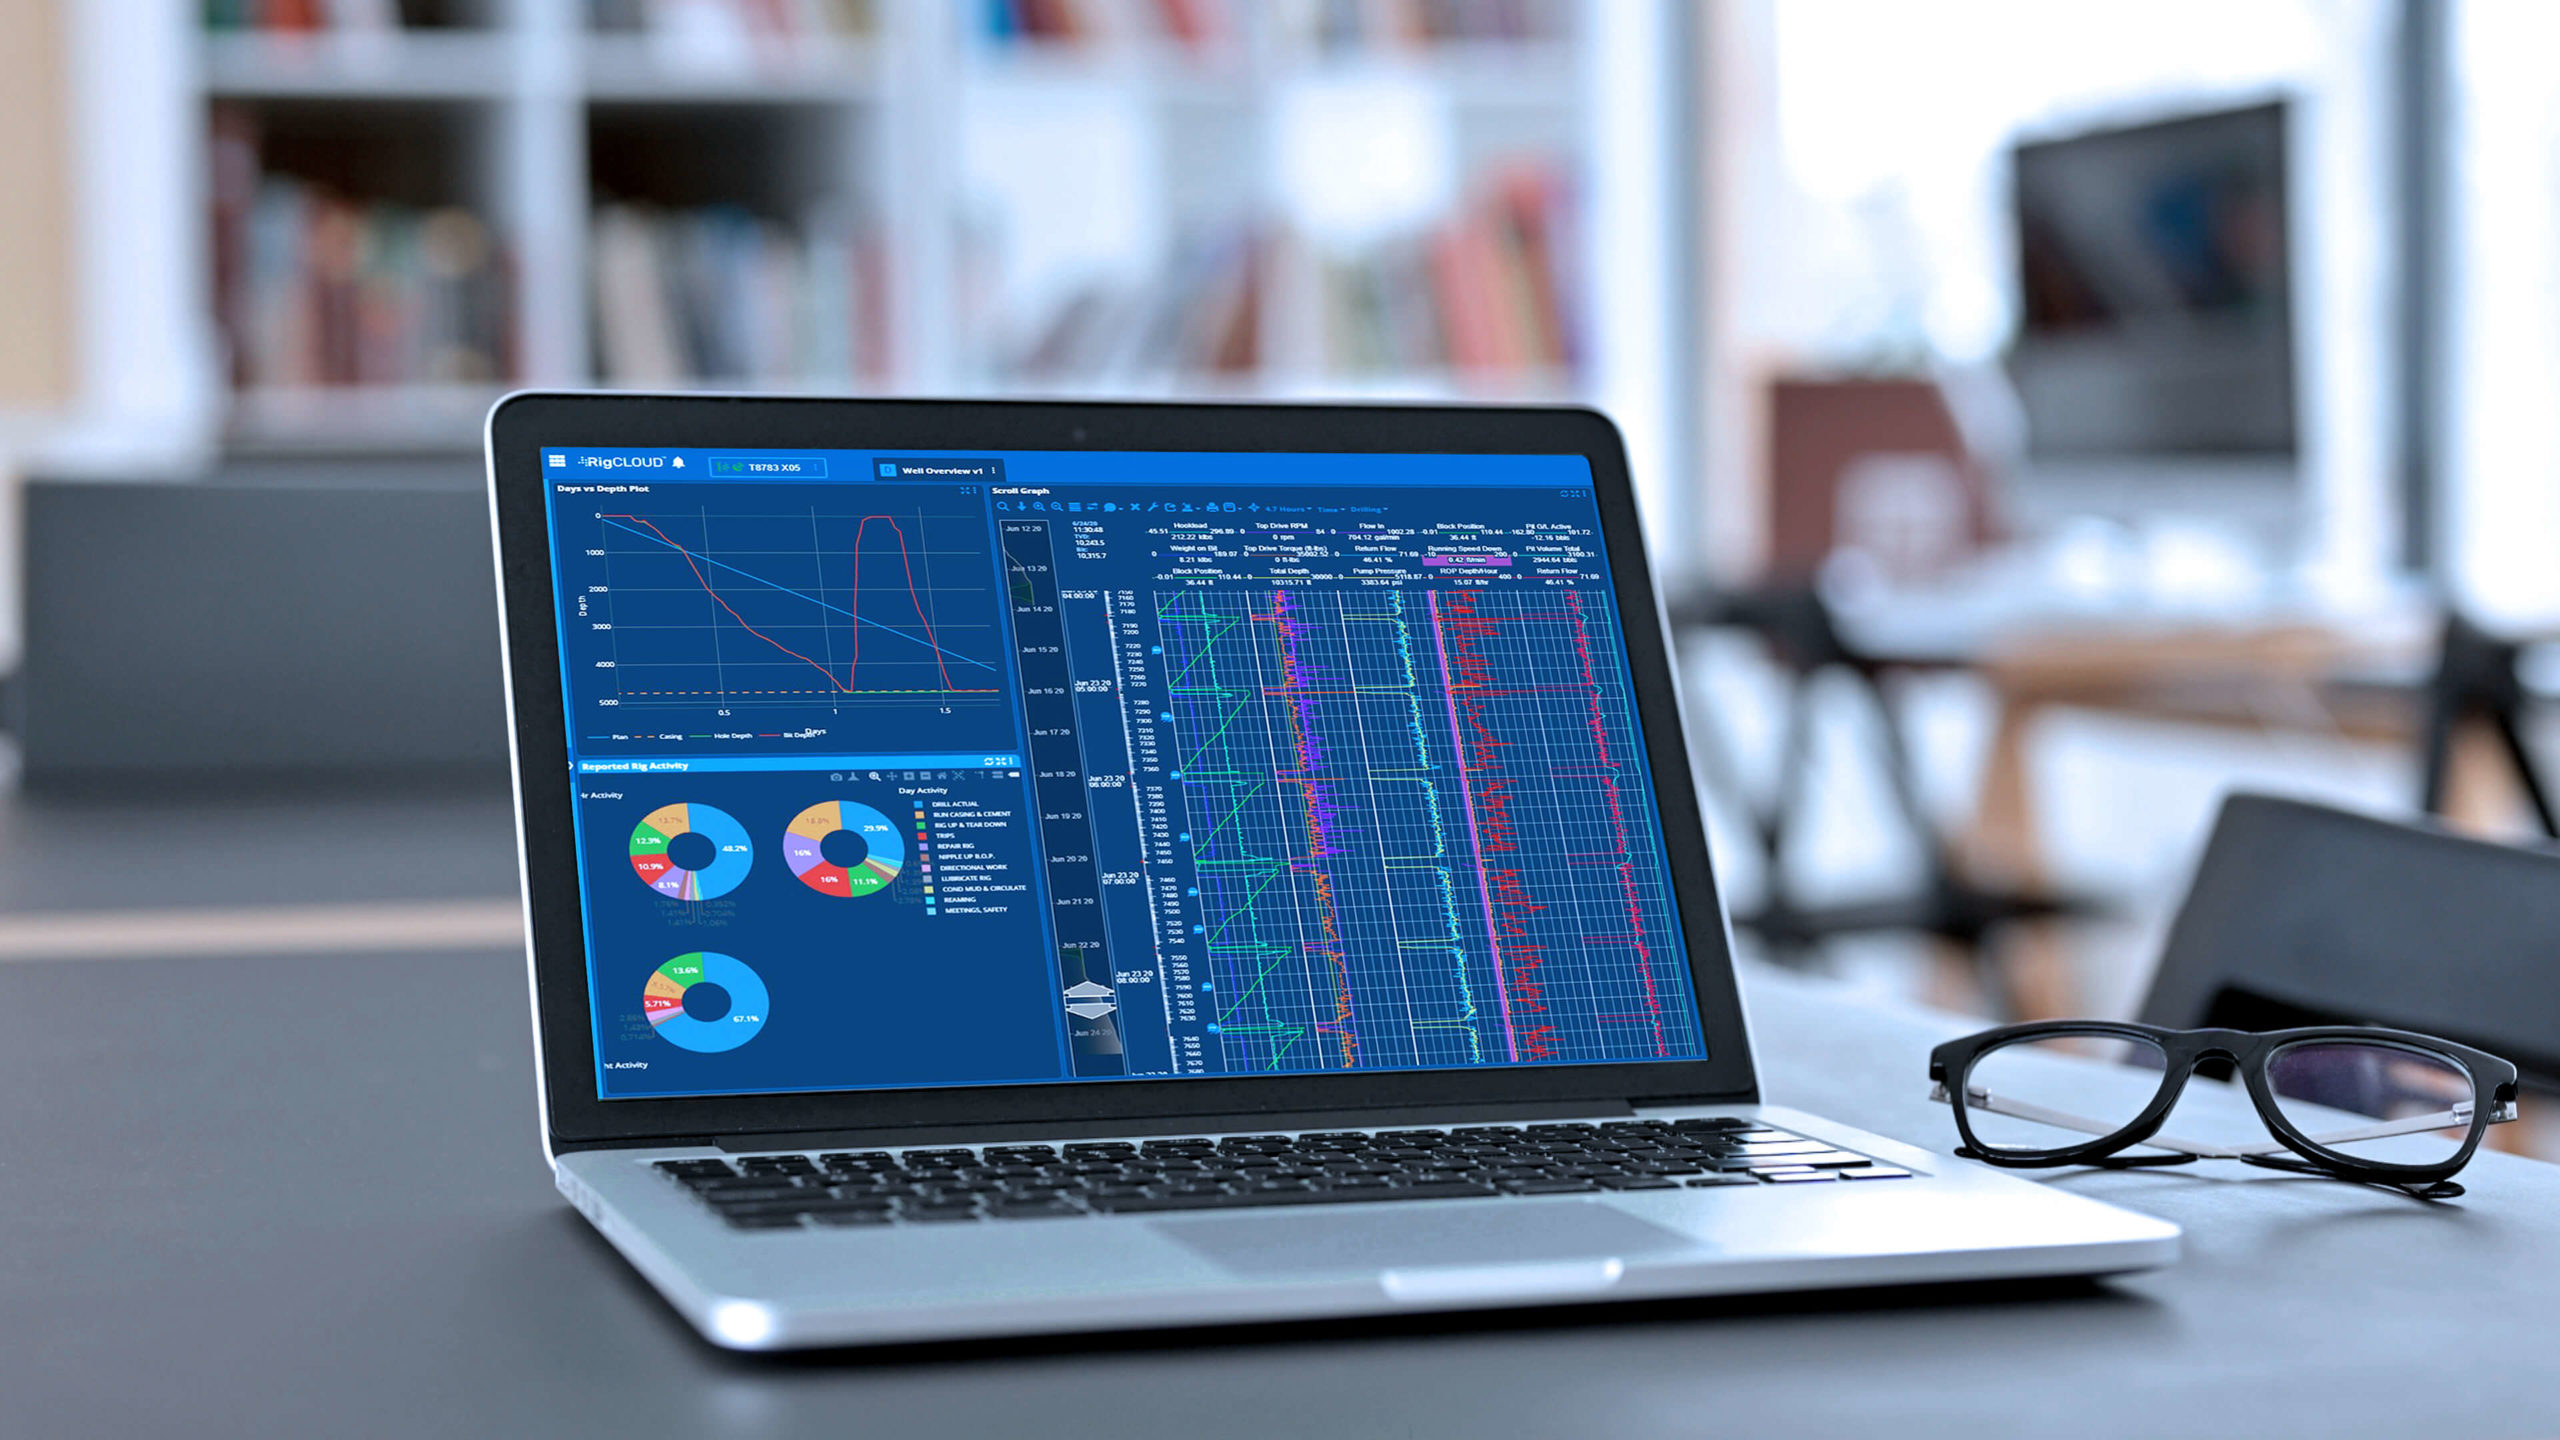
During the well planning process, the days vs depth plot and mud weight window enable the user to estimate time breakdowns of activities and select the right mud weight plan. Quickly monitor hole conditions through torque and drag broomstick plots.


Drilling efficiency monitoring tools
Improve understanding of drilling performance relative to drilling efficiency trends and formation changes by analyzing mechanical specific energy (MSE), rate of penetration (ROP) and Gamma Ray on a single depth plot.

Operations-specific visualizations
Intuitive dashboards and KPI’s to address your well construction analytical needs and help you realize optimal performance

Fully customizable dashboards
Create visualizations on the fly with the help of out-of-the-box templates and KPI’s

Work with a Digital Operations engineer
Discover and create solutions that are tailored to your needs